Curriculum Information
0. Cover, Checklist
1. Wordlist
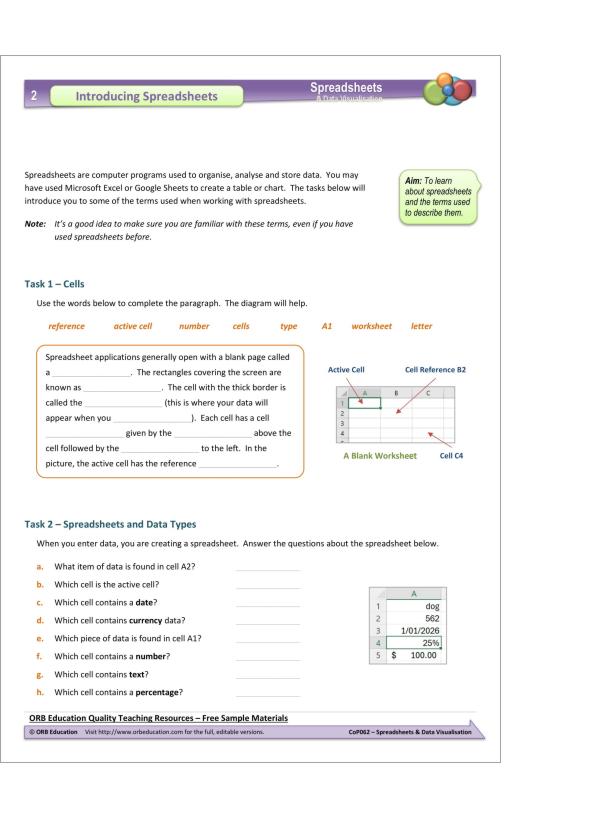
2. Introducing Spreadsheets
AC V9.0 (7-8): Acquire, interpret and model with spreadsheets and represent data with integers and binary.
NSW Comp Tech (2024) – CT-Data / CT-Net: ¤ acquires, represents, analyses and visualises simple and structured data
3. Basic Excel Skills
4. Google sheets
5. Sorting & Filtering
AC V9.0 (7-8): – using a spreadsheet table to model objects and events, including choosing appropriate formats for each column, and filtering and sorting rows to answer questions
NSW DT(Tech Mand): – filtering or sorting to answer a specific question
NSW Comp Tech (2024) – CT-Data: ¤ Filter, group and sort data using a spreadsheet, including using filters and sorting, using conditional formatting and grouping and aggregating data:
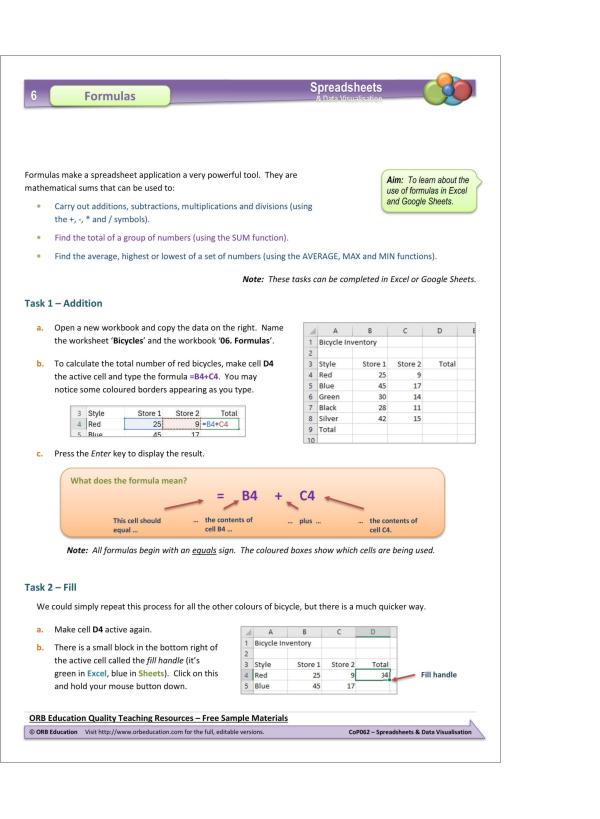
6. Formulas
NSW Comp Tech (2024) – CT-Data: ¤ Summarise data using formulas, functions and features of a spreadsheet…
7. Plots and Trendlines
AC V9.0 (7-8): Recap 5-6: Develop confidence and competencies in using digital systems to create displays of data, such as visualisations, which assist in interpreting data sets.
NSW DT(Tech Mand): · interpret and visualise data using a range of software to create information. (ACTDIP026)
NSW Comp Tech (2024) – CT-Net / CT-UE: ¤ Visualise data to identify trends, patterns, relationships and outliers using a range of tools:
AC V9.0 (7-8): Model structured data in meaningful ways using spreadsheets and single-table databases, and analyse and visualise the data to extract meaning from it.
NSW DT(Tech Mand): – using a graph to identify patterns, trends and outliers
NSW Comp Tech (2024) – CT-Data: ¤ Generate a data visualisation to identify trends and outliers using a range of tools:
AC V9.0 (7-8): – visualising multidimensional data by choosing appropriate graphs, for example a scatter plot of food prices and sales, coloured by each food’s sugar content, or diagrams such as a social network diagram and maps of crime rates by location to reveal trends, outliers or other information
8. Validating Data
AC V9.0 (7-8): Validate the data they acquire to ensure it is accurate and consistent.
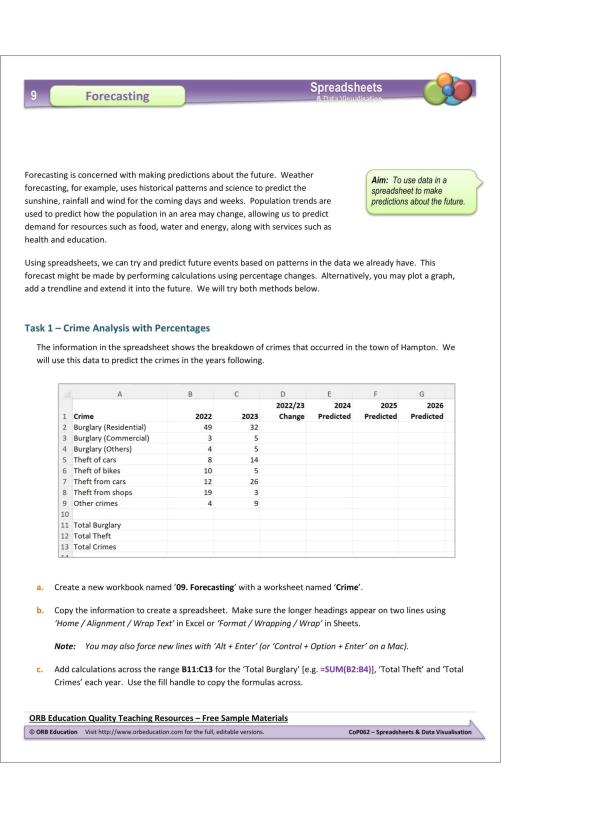
9. Forecasting
AC V9.0 (7-8): · analyse and visualise data using a range of software, including spreadsheets and databases, to draw conclusions and make predictions by identifying trends (AC9TDI8P02)
AC V9.0 (7-8): – summarising data based on its attributes to identify trends and make predictions, for example sorting crime data by type of offence, showing that burglaries have decreased over time to predict fewer burglaries will happen next year
AC V9.0 (7-8): – making predictions about future population distribution of First Nations Australians based on identified trends, for example analysing and visualising data using spreadsheets and databases on their population growth in metropolitan areas
10. Collaborating on Spreadsheets
AC V9.0 (7-8): – collaborating effectively online using cloud storage, for example setting up and managing a shared space in an online repository…
NSW DT(Tech Mand): LS – – collaboration
NSW Comp Tech (2024) – UE: ¤ manages, documents and explains individual and collaborative work practices
AC V9.0 (7-8): Select and use a range of digital tools efficiently and responsibly to create, locate and share content; and to plan, collaborate on and manage projects.
AC V9.0 (7-8): – determining and recording the tasks, responsibilities and timeframes for a collaborative project, for example using a spreadsheet to record tasks and their sequence, critical dates and who is responsible for each task so a project can be finished on time
11. Algorithms and the IF Function
AC V9.0 (7-8): Represent and communicate their algorithmic solutions using flowcharts and pseudocode.
NSW DT(Tech Mand): · design algorithms that use a range of data types, branching and iteration and represent them diagrammatically and in English (ACTDIP029)
AC V9.0 (7-8): – describing algorithms with nested control structures, including a nested if, for example IF it is raining THEN [IF parents are home THEN drive to school]; or an IF inside a loop, for example REPEAT [select the largest coin smaller than the remaining total, and subtract it] UNTIL the remainder is zero
12. Conditional Formatting
NSW Comp Tech (2024) – CT-Data: ¤ Filter, group and sort data using a spreadsheet, including using filters and sorting, using conditional formatting and grouping and aggregating data:
13. Skills 1 – Sports
Various from above.
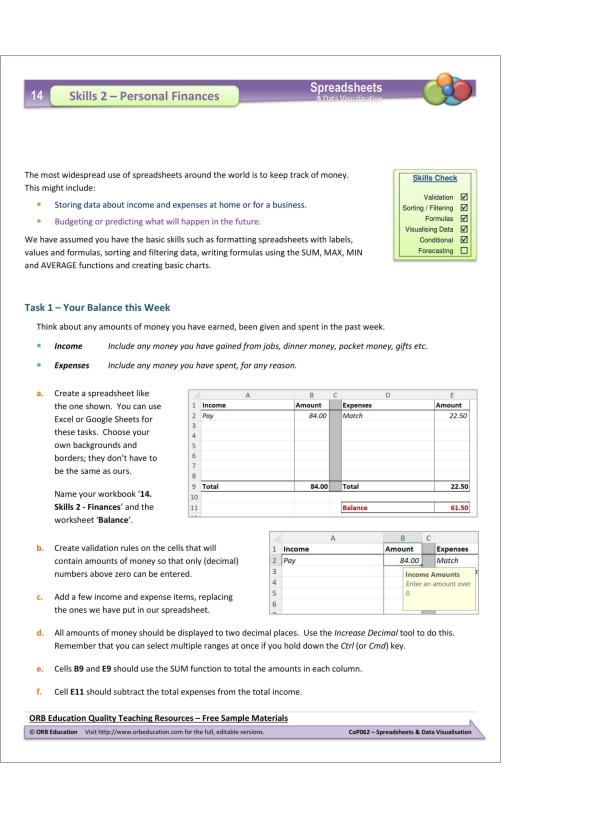
14. Skills 2 – Personal Finances
NSW DT(Tech Mand): – calculating a budget or numerical simulation
Various from above.
15. Skills 3 – Students
Various from above.
16. Skills 4 – Environment
Various from above.
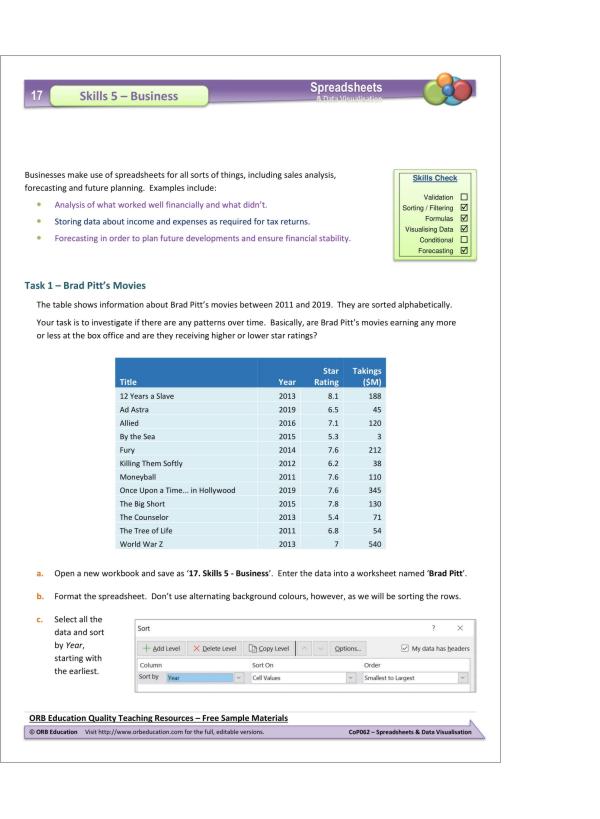
17. Skills 5 – Business
Various from above.
18. Skills 6 – Staff and Salaries
Various from above.
By Curriculum
Australian Curriculum V9.0 (2024)
AC V9.0 (7-8): – collaborating effectively online using cloud storage, for example setting up and managing a shared space in an online repository…
AC V9.0 (7-8): – describing algorithms with nested control structures, including a nested if, for example IF it is raining THEN [IF parents are home THEN drive to school]; or an IF inside a loop, for example REPEAT [select the largest coin smaller than the remaining total, and subtract it] UNTIL the remainder is zero
AC V9.0 (7-8): – determining and recording the tasks, responsibilities and timeframes for a collaborative project, for example using a spreadsheet to record tasks and their sequence, critical dates and who is responsible for each task so a project can be finished on time
AC V9.0 (7-8): – making predictions about future population distribution of First Nations Australians based on identified trends, for example analysing and visualising data using spreadsheets and databases on their population growth in metropolitan areas
AC V9.0 (7-8): – summarising data based on its attributes to identify trends and make predictions, for example sorting crime data by type of offence, showing that burglaries have decreased over time to predict fewer burglaries will happen next year
AC V9.0 (7-8): – using a spreadsheet table to model objects and events, including choosing appropriate formats for each column, and filtering and sorting rows to answer questions
AC V9.0 (7-8): – visualising multidimensional data by choosing appropriate graphs, for example a scatter plot of food prices and sales, coloured by each food’s sugar content, or diagrams such as a social network diagram and maps of crime rates by location to reveal trends, outliers or other information
AC V9.0 (7-8): · analyse and visualise data using a range of software, including spreadsheets and databases, to draw conclusions and make predictions by identifying trends (AC9TDI8P02)
AC V9.0 (7-8): Acquire, interpret and model with spreadsheets and represent data with integers and binary.
AC V9.0 (7-8): Model structured data in meaningful ways using spreadsheets and single-table databases, and analyse and visualise the data to extract meaning from it.
AC V9.0 (7-8): Recap 5-6: Develop confidence and competencies in using digital systems to create displays of data, such as visualisations, which assist in interpreting data sets.
AC V9.0 (7-8): Represent and communicate their algorithmic solutions using flowcharts and pseudocode.
AC V9.0 (7-8): Select and use a range of digital tools efficiently and responsibly to create, locate and share content; and to plan, collaborate on and manage projects.
AC V9.0 (7-8): Validate the data they acquire to ensure it is accurate and consistent.
NSW Digital Technologies (Tech Mandatory)
NSW DT(Tech Mand): – calculating a budget or numerical simulation
NSW DT(Tech Mand): – filtering or sorting to answer a specific question
NSW DT(Tech Mand): – using a graph to identify patterns, trends and outliersNSW Comp Tech (2024) – CT-Data: ¤ Generate a data visualisation to identify trends and outliers using a range of tools:
NSW DT(Tech Mand): · interpret and visualise data using a range of software to create information. (ACTDIP026)
NSW DT(Tech Mand): LS – – collaboration
NSW DT(Tech Mand): · design algorithms that use a range of data types, branching and iteration and represent them diagrammatically and in English (ACTDIP029)
NSW Computing Technology (2024)
NSW Comp Tech (2024) – CT-Data / CT-Net: ¤ acquires, represents, analyses and visualises simple and structured data
NSW Comp Tech (2024) – CT-Data: ¤ Filter, group and sort data using a spreadsheet, including using filters and sorting, using conditional formatting and grouping and aggregating data:
NSW Comp Tech (2024) – CT-Data: ¤ Filter, group and sort data using a spreadsheet, including using filters and sorting, using conditional formatting and grouping and aggregating data:
NSW Comp Tech (2024) – CT-Data: ¤ Summarise data using formulas, functions and features of a spreadsheet…
NSW Comp Tech (2024) – CT-Net / CT-UE: ¤ Visualise data to identify trends, patterns, relationships and outliers using a range of tools:
NSW Comp Tech (2024) – UE: ¤ manages, documents and explains individual and collaborative work practices NSW Comp Tech (2024)

Reviews
There are no reviews yet.